
The Seasons of Bitcoin
How Bitcoin’s Price Moves, and When Winter Ends
Those who bought Bitcoin at its peak in December 2013 waited 1,477 days to see a new high in 2017, those who bought at the December 2017 highs waited 1,423 days for a new high in 2021, and those who bought in November 2021 waited 1,428 days for the high on October 6, 2026.
This pattern is the most intriguing phenomenon in the digital asset market.
Why the chart should be read on a logarithmic scale
Bitcoin has gone from eight cents to 126,000 dollars. On a normal chart, the first ten years would be a flat line pressed against the bottom, and the last two years a vertical wall: you wouldn’t see anything that happened before 2020.
The logarithmic scale solves this problem by measuring changes in percentage rather than in dollars. Each vertical tick is worth ten times the one below it. A doubling from $100 to $200 takes up the same space as a doubling from $50,000 to $100,000.

Viewed this way, price movements become easier to interpret. You can see four steep rises followed by four sharp declines, and you can see that the rises become less steep each time and the declines less sharp each time. The light blue dotted line is the long-term growth curve we’ll discuss later: the price moves around it, above and below it, without ever straying from it permanently.
What Happens Every Four Years
The purple vertical lines mark the halvings. What are halvings? Approximately every ten minutes, those who keep the Bitcoin network running receive newly minted bitcoins as a reward. The protocol stipulates that this reward is halved every 210,000 blocks—roughly every four years. From 50 bitcoins per block in 2009, to 25 in 2012, 12.5 in 2016, 6.25 in 2020, and 3.125 in 2024. The rule has been hard-coded since day one, and no one can change it.
The practical effect is that the flow of new bitcoins entering the market at that particular moment is halved overnight. If demand remains the same while the new supply is halved, the price tends to rise. This is the most common explanation of the cycle, and it is likely incomplete: we’ll return to this at the end.
The Rhythm
Let’s overlay the four cycles, starting each one from its own low, and measure the price not in dollars but in “times the low.”

The three triangles on the right represent the peaks of the last three cycles. They occur 1,067, 1,059, and 1,062 days after the starting low—an eight-day difference over nearly three years. No one coordinated anything. These are three markets with different participants, regulations, and infrastructure that took the same amount of time to follow the same path.

Daily closing prices. The 2021 peak is $69,000, and the 2025 peak is $126,198 if you look at the intraday high instead of the close. The low on June 30, 2026, is provisional: the cycle is still ongoing.
The three phases have equally stable durations.

The gain is halved each time. So is the loss.
This is the part that most social media comments overlook.

From its low to its high, Bitcoin’s value increased 539-fold, then 112-fold, then 21-fold, and then 8-fold. The multiplier is divided by a number between three and five with each cycle. In the opposite direction, the decline from peak to trough went from −84.5% to −83.8%, then −76.7%, and in this cycle so far, −53.0%.
Yet each cycle creates more wealth than the previous one
The two things seem to contradict each other, yet they go together perfectly. The percentage return declines because the starting base is much larger each time. But the wealth in dollars that this return generates grows—and grows significantly.

In the first cycle, the total value of all bitcoins rose from $22 million to $13.7 billion: $14 billion in wealth created, with a multiplier of 539 times. In the most recent cycle, the multiplier was just 7.9 times, but the total value rose from 303 to 2,488 billion: nearly 2,200 billion dollars created—a 160-fold increase.
The progression of wealth created is 14, then 326, then 1,219, then 2,185 billion. It keeps rising, even if the pace is slowing: the second cycle created 24 times more than the first, the third nearly 4 times more than the second, and the fourth less than double the third. Percentage returns and absolute wealth are converging on the same point from opposite directions.
For investors, the difference is not merely academic. A 539-fold multiplier exists only in a market so small that no serious capital can enter it without moving the price. The 7.9-fold multiplier of the last cycle was achievable on billions of dollars, in regulated instruments, with a liquid market on the other side. These are two numbers that do not describe the same world.
The Line of Gravity
If you plot price against the time elapsed since the network’s inception, using a logarithmic scale on both axes, the data points lie along a straight line. In other words: price grows as a power of time. The formula that best describes sixteen years of data is price ≈ time to the power of 5.65, where time is counted in days starting from January 3, 2009. It explains 96% of the movements. It is the dotted line in the first graph.
It is not a law of physics and guarantees nothing. It is a description: so far, the price has behaved this way.
If the price grows as a power of time, the expected annual return decreases as the years go by. In 2013, that same formula implied a return of 126% per year. In 2017, 66%. Today, 32%. In 2035, it will be 21%. The time required to double the value has gone from seven months in 2013 to two years and four months today.
Bitcoin is slowing down because the same curve that yielded 126% in 2013 now yields 32%. This slowdown is part of the model.
And here’s the most useful data point. Relative to this line, the cycle highs are flattening out, while the lows remain where they’ve always been.
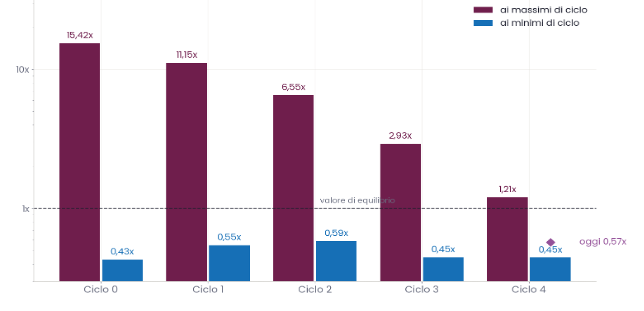
At the 2011 peak, the price was fifteen times the line. In 2013, eleven times. In 2017, six and a half times. In 2021, less than three times. In 2025, just 1.21 times: the latest peak was almost exactly on the equilibrium line. The lows, on the other hand, were 0.43—0.55—0.59—0.45, and the June 2026 low was again 0.45. A surprisingly consistent floor across five cycles and fifteen years.
At the low on June 30, 2026, we were at 0.45 times the line, exactly where the lows of 2011 and 2022 had stopped. After the summer rebound, we climbed back to 0.57 times: still in the lower half of the historical range, with about 1,400 out of 5,900 days spent at a relatively lower price than this one.
Where We Stand Now

The high for this cycle was on October 6, 2025, at $126,198. From there, the price fell to $58,605 on June 30, 2026, and then rebounded: August closed up 24.9%, the best month of the year, and on September 6, 2026, the closing price was $80,301. We are 335 days from the high, 869 days from the April 2024 halving, and 68 days from the June low, with a 37% rebound from that low and a 36% lag from the all-time high.
In the three previous cycles, the low occurred between 364 and 406 days after the high. If this pace continues, the bottom will occur between October 5 and November 16, 2026—that is, in one or two months. Whether the June low is already the definitive one or whether another, lower low will follow is a question no one has a crystal ball to answer; however, we can say that we are at a very interesting historical moment to begin investing in this asset and in the sector.
Data: daily BTC/USD series from July 18, 2010, to September 6, 2026, 5,895 observations. Source and analysis by Diaman Partners Ltd;
This document is intended for informational purposes and statistical analysis of historical data. It does not constitute investment advice or a recommendation to buy or sell financial instruments. Past performance is not indicative of future results.



Comments