
How Much Will Bitcoin Be Worth at Its Next High?
An estimate based on market capitalization, not price
Asking “how high will the price of Bitcoin go” is the wrong question—and not out of prudential caution. The price of a bitcoin depends on how many bitcoins exist, and that number changes: in 2013 there were 12 million, today 20.1 million, and in 2029 there will be 20.5 million. Comparing the 2013 price with the 2029 price means comparing two fractions with different denominators.
The right question is a different one: how much is the total supply of all bitcoins worth, and by how much does it grow with each cycle? That metric—market capitalization—behaves much more consistently than the price. Once estimated, the price is obtained by division, because future supply is the only thing in this market that is known in advance with certainty..
The Starting Point
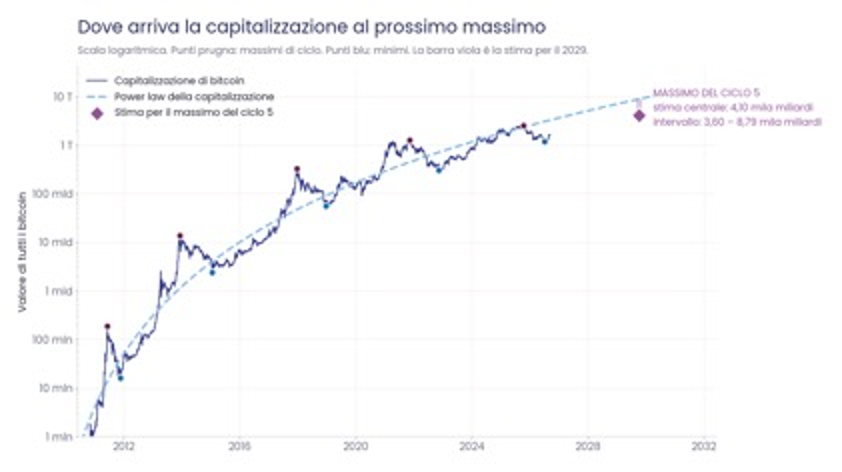
The value of all bitcoins rose from $16 million at its November 2011 low to 2,488 billion at its October 2025 high. Today, following the summer decline and rebound, we stand at 1,613 billion. The light blue line represents the same power law that describes the price, applied to market capitalization: it grows as time raised to the power of 6.23 and explains 96.6% of the movements over sixteen years.
The plum-colored points are the five cycle highs; the blue points are the five lows. These ten numbers—not the entire series—form the basis for what follows.
First assumption: when the next high will occur
This is not a random estimate. Four independent approaches lead to nearly the same point.
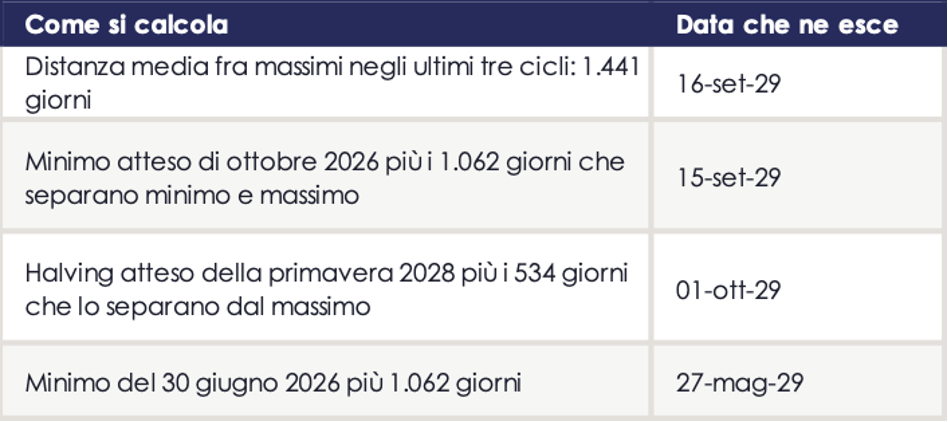
I’m using October 1, 2029. Three of the four paths reach their peak within three weeks of that date; the fourth is earlier because it starts from the June low, which may not be the final one. An error of a few months on this date shifts the final estimate only slightly: the equilibrium market capitalization grows by about 2.5% per month during that phase, so a two-month delay amounts to less than 6%.
Second assumption: how many bitcoins there will be
This is the only part of the calculation that requires no judgment. Today there are 20,081,082 bitcoins. Until the halving in the spring of 2028, 3.125 bitcoins are mined every ten minutes—that is, about 450 per day; afterward, 1.5625, or about 225. Counting the days brings the total to approximately 20,465,000 bitcoins as of October 1, 2029.
The supply grows by 1.9% over three years. This is so small that any error in this number is irrelevant compared to the others: if I’m off by 10% in my estimate of the market capitalization, the price will be off by 10%; if I’m off by 10% on the supply—which is impossible, since it’s hard-coded—the price will be off by 0.2%.
Third assumption: by how much does the market capitalization grow?
This is where the difficulty lies, and it is here that the methods split into two schools of thought that do not agree.

From one cycle peak to the next, market capitalization grew by a factor of 72.9, then 24, then 3.87, then 1.95. On a logarithmic scale, each ratio is slightly more than half the previous one: 0.74 — 0.43 — 0.49. This is an orderly deceleration, and it is the strongest pattern in the entire analysis—stronger even than the temporal regularity of the cycles.
Applying the same decay factor to the next ratio yields 1.45, which would take market capitalization from 2,488 to 3,600 billion. Applying the same reasoning to the wealth created within each cycle—14, 326, 1,219, 2,185 billion—we arrive at 2,807 billion created in cycle 5, which, starting from the June low of 1,175 billion, yields 3,980. Two different paths: 3,600 and 3,980.
The second approach is based on the power law. As of October 1, 2029, the equilibrium curve stands at 8,787 billion, and the cycle peaks have progressively approached it from above: they were 13.8 times the curve in 2011, then 12.3, then 7.1, then 2.9, and in 2025 just 1.07 times. If the next peak falls on the curve as the last one did, the market capitalization is 8,787 billion.
3,600 versus 8,700. A factor of two and a half separates the results of two methods using the same data.
Why I Choose the Lower Range
The difference isn’t technical; it’s conceptual. The power law extrapolates the level; the ratios between cycles extrapolate the rate at which that level grows. These are two different things, and right now they tell us different things because today’s market capitalization is 1,613 billion compared to an equilibrium curve of 3,239: we’re halfway below the line.
Those who use the power law are implicitly assuming that this 50% discount will close by 2029. It’s a bold assumption, and it has an uncomfortable arithmetic consequence: it implies 74% annual growth for three consecutive years. The ratio method implies 30–35% per year, which is exactly the return that the power law itself currently attributes to Bitcoin as an instantaneous rate. In other words: the low-end method assumes that Bitcoin grows at the rate predicted by the curve without making up for the accumulated lag; the high-end method assumes that it grows at the predicted rate and, in addition, makes up for all the lag.
There is also a test that can be performed, and it is the one that convinces me. If you draw a straight line through the four most recent peaks on a logarithmic scale and ask it to replicate the observed ratios, that line predicts a 4.75-fold increase between 2017 and 2021 compared to the actual 3.87-fold increase, and a 3.14-fold increase between 2021 and 2025 compared to 1.95. It overestimated both of the last two cycles, and by increasingly wider margins. Asking the same line to predict 2029 would mean repeating the same mistake a third time.
I therefore take 4,100 billion as the central estimate—slightly above the average of the two lower scenarios—and use 8,787 as the upper limit of the scenario in which the power law truly holds.

From market capitalization to price
At this point, the calculation is straightforward. 4,100 billion divided by 20,465,000 bitcoins equals $200,338. Using 3,600 billion yields $175,907, while using 8,787 yields $429,506.
But a peak price is a figure the market reaches for only a few days. Anyone who needs to size a position requires the average price—that is, how much a bitcoin is worth for most of the time it spends within the cycle.

The average of all daily closing prices in a cycle, divided by the cycle’s high, was 20.4% — 15.8% — 34.8% — 52.0%. It’s rising, and the reason is understandable: volatility is falling, peaks are less pronounced, and the price spends more time near its high rather than reaching it for a week and then crashing. For Cycle 5, I’m assuming 55%, which is slightly higher than the last observed figure.


The base-case scenario corresponds to a price that, starting at $80,301 on September 6, 2026, grows by 35.5% per year for three years. It’s not an exciting forecast, nor is it meant to be: it’s what you get when you take the deceleration seriously instead of ignoring it.
What Could Disrupt This Projection
Three observations of the ratio between cycles do not constitute a sample. The decay factor I use—just over half with each cycle, on a logarithmic scale—is estimated based on three numbers, and the third (0.49) is higher than the second (0.43): it could be noise, or it could be the beginning of a stabilization. If the deceleration stops instead of continuing, the ratio for cycle 5 is not 1.45 but remains around 1.95, and the market capitalization becomes 4,850 billion, or $237,000.
Conversely, the entire line of reasoning assumes that a cycle high still exists. The 2025 peak reached 1.07 times the equilibrium curve, compared to 2.9 times in 2021: the speculative component that was inflating the peaks is running out of steam, and a cycle without a bubble is one in which the term “cycle peak” ceases to denote anything specific. If, in 2029, the price merely follows the curve without exceeding it, there will be no peak against which to measure, and the question this article answers will have been the wrong one.
Finally, market capitalization is not real wealth. It is a marginal price multiplied by all existing units, including those that haven’t moved in years and those lost forever. When I write that Cycle 4 created $2,185 billion, I am measuring an increase in book value, not money that entered the system: net flows of a much smaller magnitude were sufficient to produce it. This applies to Bitcoin just as it does to any listed stock, but here the difference between the two figures is wider than usual, and anyone basing expectations on market capitalization should be aware of this.
Data: daily BTC/USD series and circulating supply from July 18, 2010, to September 6, 2026; 5,895 observations. Source and analysis: Diaman Partners Ltd. The supply beyond September 6, 2026, is calculated based on the protocol’s issuance schedule. All cycle highs and lows are based on daily closing prices.
This document is intended for informational purposes and statistical analysis of historical data. It does not constitute investment advice or a recommendation to buy or sell financial instruments. The estimates contained herein are extrapolations of past patterns and have no predictive value. Past performance is not indicative of future results.



Comments